Create in minutes complete and graphically appealing reports, accessible from any device. Share them with whoever you want. Give your data business analysis an edge!

Do you spend valuable time analyzing and reporting
data with disappointing results?
Quickly and easily extract interesting trends from your data!
BStreams allows you to create a report from any device.
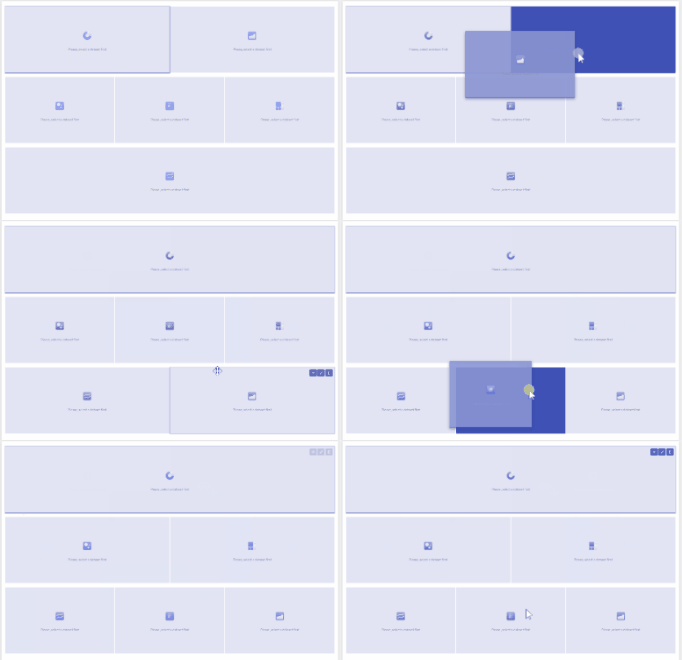
All you have to do is start from your spreadsheet then drag and drop the graphics you need. Easy.
Thanks to BStreams you can update every report in real time, by several people, in a collaborative way.
Business data analysis & interactive Reporting tool: your beacon in the night
When sharing important commercial information in an effective and understandable way among internal components of the company, customers or stakeholder, it is essential to be on the same page. This way, everybody is clear about where things stand.
Why is data reporting so important? Data provides a path that measures progress in every area of our professional and personal lives. Data informs our big business decisions as well as our day-to-day work matters.
A good data report, easy to update and understandable at a glance, will clearly suggest where to spend the most time and resources and what needs more organisation or attention. It’s like the light of a beacon guiding you through the night.
Charts, tables and maps will help you present data effectively. Whether it’s a quarterly sales report or your team research, BStreams allows you to quickly create a report and share it with anyone. Bstreams can be read on any device of your choice.
Our free tool gives you the ability to create interactive reports that you can update in real time.
Why is data reporting so important?
Data reporting is the process of collecting and formatting data in order to translate it into a digestible and engaging format. Through business data analysis it becomes possible to take the raw data and refine it. Use BStreams, for example, to assess the ongoing performance of your organisation, gauge your effort in the right direction, summarize financial information such as revenues or profits and so on.
Depending on who creates the report, some KPIs will be used and valued rather than others, skimming the data on the basis of their geolocation, distribution over time, target audience, etc. From the same dataset, different people can compose different reports based on their purpose and the message to be conveyed.
Data reporting allows the information you have gathered to be given the form and strength of a message.
What is interactive data reporting?
Your data reports can answer basic or complex questions about your business. Data can show the status of valuable information but if left in Excel files, it would lose valuable details.
This is one of the reasons why data visualisation is so powerful. Putting the data into eye-catching charts, maps, and tables allows everyone to understand and remember what the data is telling, without the risk of missing important details.
Static reporting though, while it can be accurate, it always has its limits, primarily due to the lack of real-time information.
Bstreams’ interactive options add a major ace in the hole to your data reports.
Static data reports usually use the same format over a period of time and pull from one source of data. They are nothing more than a recorded list of facts and figures.
On the other hand, when you create an interactive report with BStreams you can:
- Easily use your spreadsheets
- Dynamically filter data to show and summarize different aspects and points of view.
- Give your audience the ability to independently discover more of the data you’re presenting by using filters.
- Update the report in real time to continue your analysis over time.
Data reporting with BStreams is super easy
Simply, take the data you have collected and identify the most important information you may be sharing with it. Our business data analysis & interactive reporting tool will help you process and collect a large amount of information!
Thanks to BStreams you can arrange the data and display it in an easy-to-read format with minimal effort. There is no need to dive into code or be an expert at analytics. We help you to extract information from the data keeping it simple: your result will always be understandable and beautiful to look at.
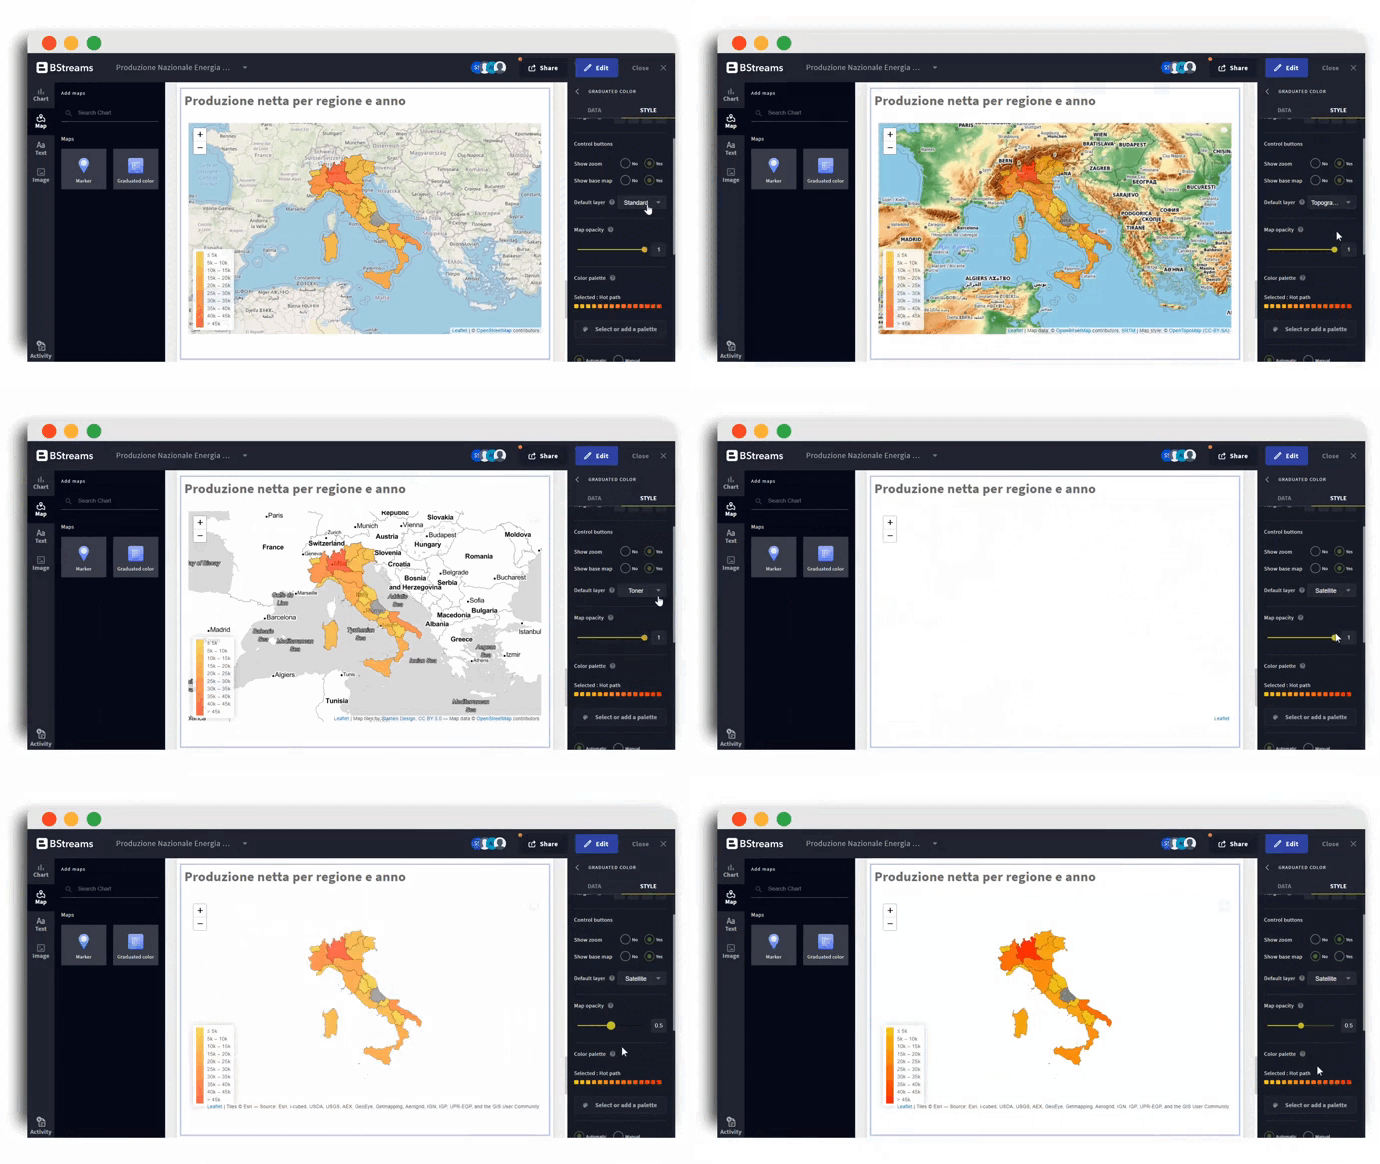
Enrich any report with graphs, tables and maps, then personalize it by adding textual content and images.
Customize the style of your report and make it suitable for the coordinated image of your brand. Add background images, calibrate colors, change font styles in minutes.
Invite other team members to collaborate on the report. Publish it directly on your web page or share the link through our viewer.
The power of business data analysis & interactive reporting
When using static reporting, the updating process is laborious and tedious. This, especially if you have a large amount of data, can become a serious issue.
It happens that weeks pass from the creation of the report to its publication: in the meantime, your report has become obsolete. Now imagine this other situation: the most recent data leads to different conclusions but you cannot effectively show them because you have already finalized your report… You will have wasted hours of work to reassemble it or, worse, produce another one!
With BStreams these are issues of the past.. Our interactive reporting tool can handle multiple inputs simultaneously, easily visualise complex data and update reports in real time.
Use data reporting for…
Decisions based on gut instincts may or may not generate value… Data reporting on the other hand, allows you to make data-driven decisions that always generate business value.
There are multiple types of data reporting, such as:
Periodic reports – they provide summaries of performance at fixed intervals. These are often used for communicating performance to stakeholders and shareholders.
Analytical reports – they combine qualitative and quantitative data to tell a business process or strategy, with one or more goals set.
Compliance reports – they provide information on how company and customer data is obtained, stored, distributed and of course secured.
Dashboard reports – they provide a visual representation of the Key Performance Indicators (KPIs) and the Objectives and Key Results (OKRs) of a project, a company or a team.
Regardless of the type of report you are required to make, here are three tips for producing quality data reporting.
Before you start, you need to be sure of:
- Knowing where to get your information and how to collect data
- Understanding what you’re looking for and who you are making it for
- Having a clear message in mind
Now you are all set to present and structure your data reports using Bstreams. Select the most relevant information and visualise the data effectively with our business data analysis & interactive reporting tool, starting today.
BStreams, data reporting made easy

Any graphics you need
Get the right visualisation for your data choosing among our library of charts.

Easy sharing with stakeholder and audience
Create your report and share it immediately on your website or via link, with whoever you want.

One result, multiple data files
Produce awesome reports from multiple data source files that you can update in a flash. Make even the most complex topic simple and understandable.

Easy to make, even easier to read
Get an impressive result without being an expert. The final layout is clear and clean, designed to help anyone understand all the elements in the stream.
No one will fall asleep reading your reports anymore…
BStreams allows you to create any type of report even in a collaborative way. You don’t need to involve your IT department, all you need is the right data sources on hand
- Wide range of charts and maps to suit all cases
- Just update the data source, the report will change automatically
- Options to highlight where you need it
- Markup and html languages for a further level of customization

